To calculate result you have to disable your ad blocker first.

ABCs of Data: Definitions, Types, Applications, and Examples
Table of Content
In various fields of study, including Mathematics, Science, Statistics, Business, Engineering, Computer science, and Economics data is compulsory. One of the best ways to look at data is to summarize and make predictions about future behavior based on past and current observations, which were presented by mathematics.
This article will help you to understand the basic concept of data in mathematics, and it gave you a deep knowledge of its types in mathematics, along with the sources of the collection with examples.
What is data?
Data is a collection of raw facts and figures. In its raw form, data may lack meaning or context. However, when organized, interpreted, and analyzed, data can give valuable information and facilitate decision-making processes.
In mathematics, mathematicians mostly work on numeric data. Numeric data can be calculated. For example, the age of a person, and the distance between two different cities. We took data in a numeric form for the above-mentioned examples.
Types of Data
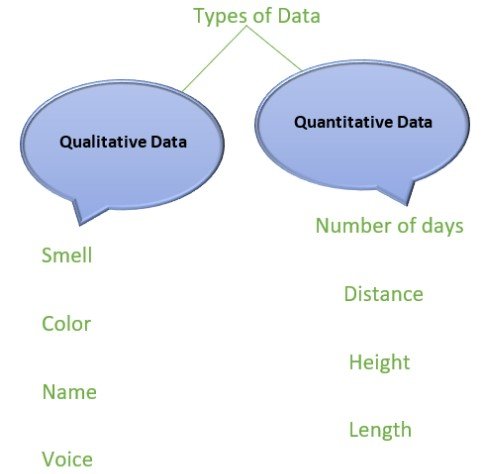
The main data types are as follows:
- Qualitative data
- Quantitative data
Qualitative data
Qualitative data is non-numerical data that is descriptive in character. It describes a thing or phenomenon of qualities, characteristics, and properties.
Quantitative data
Quantitative data refers to any information that can be quantified and measured. It entails gathering information in the form of numbers, counts, measures, or statistics. It differentiates itself via quantitative data objectivity as well as the capacity to provide significant insights through mathematical and statistical analysis.
Sources and Collection Methods
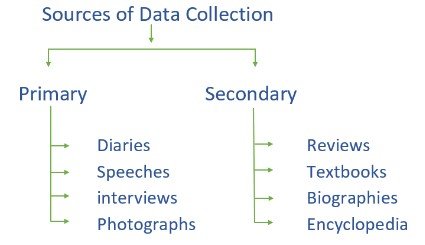
The main method of collecting data are as follows:
- Primary source
- Secondary source
Primary source
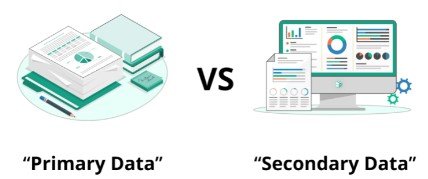
Primary data refers to information that is collected firsthand from sources. This data is specific to the purpose of the study or analysis and is obtained through surveys, interviews, observations, or experiments. Primary data collection provides researchers with control and the ability to gather data tailored to their needs.
Secondary source
Secondary data is information that has been collected by someone else for a different purpose but can be repurposed for analysis. It includes data from research studies, reports, articles, and public databases.
Secondary data collection offers convenience and cost savings, as it eliminates the need for primary data collection. However, ensuring its reliability and relevance is crucial.
Data Administration
Data organization is also known as data administration. The act of organizing and arranging data in a logical and systematic manner to allow for information storage, retrieval, and modification is called data administration.
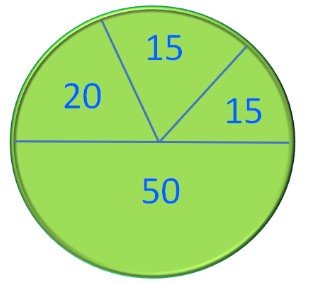
We can easily organize data in math by using folders, table graphs, and also pie charts.
Table Form:
A table form is a structured data representation in which rows and columns are used. It is frequently used to organize and display data in a tabular form in relational databases and spreadsheets.
Graphical Form:
A graph form is a data format that illustrates connections or linkages between items. It is made up of nodes (also known as vertices) and edges (connections between nodes).
Pictorial Form:
Photos, charts, diagrams, or infographics are used to convey information when data is presented visually, rather than typical verbal or numerical representations. This visual representation is intended to aid with challenging topic comprehension, clarity, and communication.
Favorite Food | Number of Students |
Rice | 15 |
Pizza | 50 |
Bread | 15 |
Burger | 20 |
Applications of Data
Some applications of data are as follows:
Healthcare
In healthcare, data analysis helps to enhance patient outcomes, expand disease surveillance, and optimize budget allocation. Electronic health records, medical imaging, genomics, and wearables provide massive amounts of data that may be used to identify patterns, diagnose ailments, and customize treatment plans.
Finance
The banking business relies heavily on data analysis for risk management, fraud detection, and investment decisions. By studying market data, economic variables, and customer behavior, financial institutions may make informed judgments, manage risks, and identify profitable opportunities.
Retail
In the retail industry, data analysis helps organizations better understand client preferences, optimize pricing tactics, and personalize marketing initiatives. Retailers may adjust their goods, enhance customer experiences, and drive sales growth by analyzing sales data, consumer demographics, and purchase trends.
Marketing
Data analysis is critical in marketing for market research, consumer segmentation, and campaign optimization. Marketers may target the correct audience, offer individualized messaging, and analyze the efficiency of their efforts by using demographic data, social media interactions, and website analytics.
Manufacturing
Data analysis plays a crucial role in optimizing manufacturing processes, improving quality control, and predictive maintenance. By analyzing production data, sensor readings, and machine performance, manufacturers can identify bottlenecks, reduce downtime, and enhance overall operational efficiency.
Example section
Example:
The following table shows the total number of apples sold by Ayyan in a different time period. What would be the total number of apples sold by Ayyan in a day?
Time period | No of Apples |
Morning | 15 |
Afternoon | 25 |
Evening | 30 |
Solution
First, we have to arrange the data and then we have to add the data.
15 + 25 + 30 = 70
Here,
We can clearly see that the information obtained by the given data is 70. In this way, we can utilize the data. The total number of apples sold by Ayyan is 70.
Wrap up
Data is a tremendous resource that has altered the way businesses operate and make choices. It can take many different forms and must be properly analyzed to ascertain its genuine value. Adopting data analysis tools may assist firms in gaining insights, increasing efficiency, and gaining a competitive advantage.
